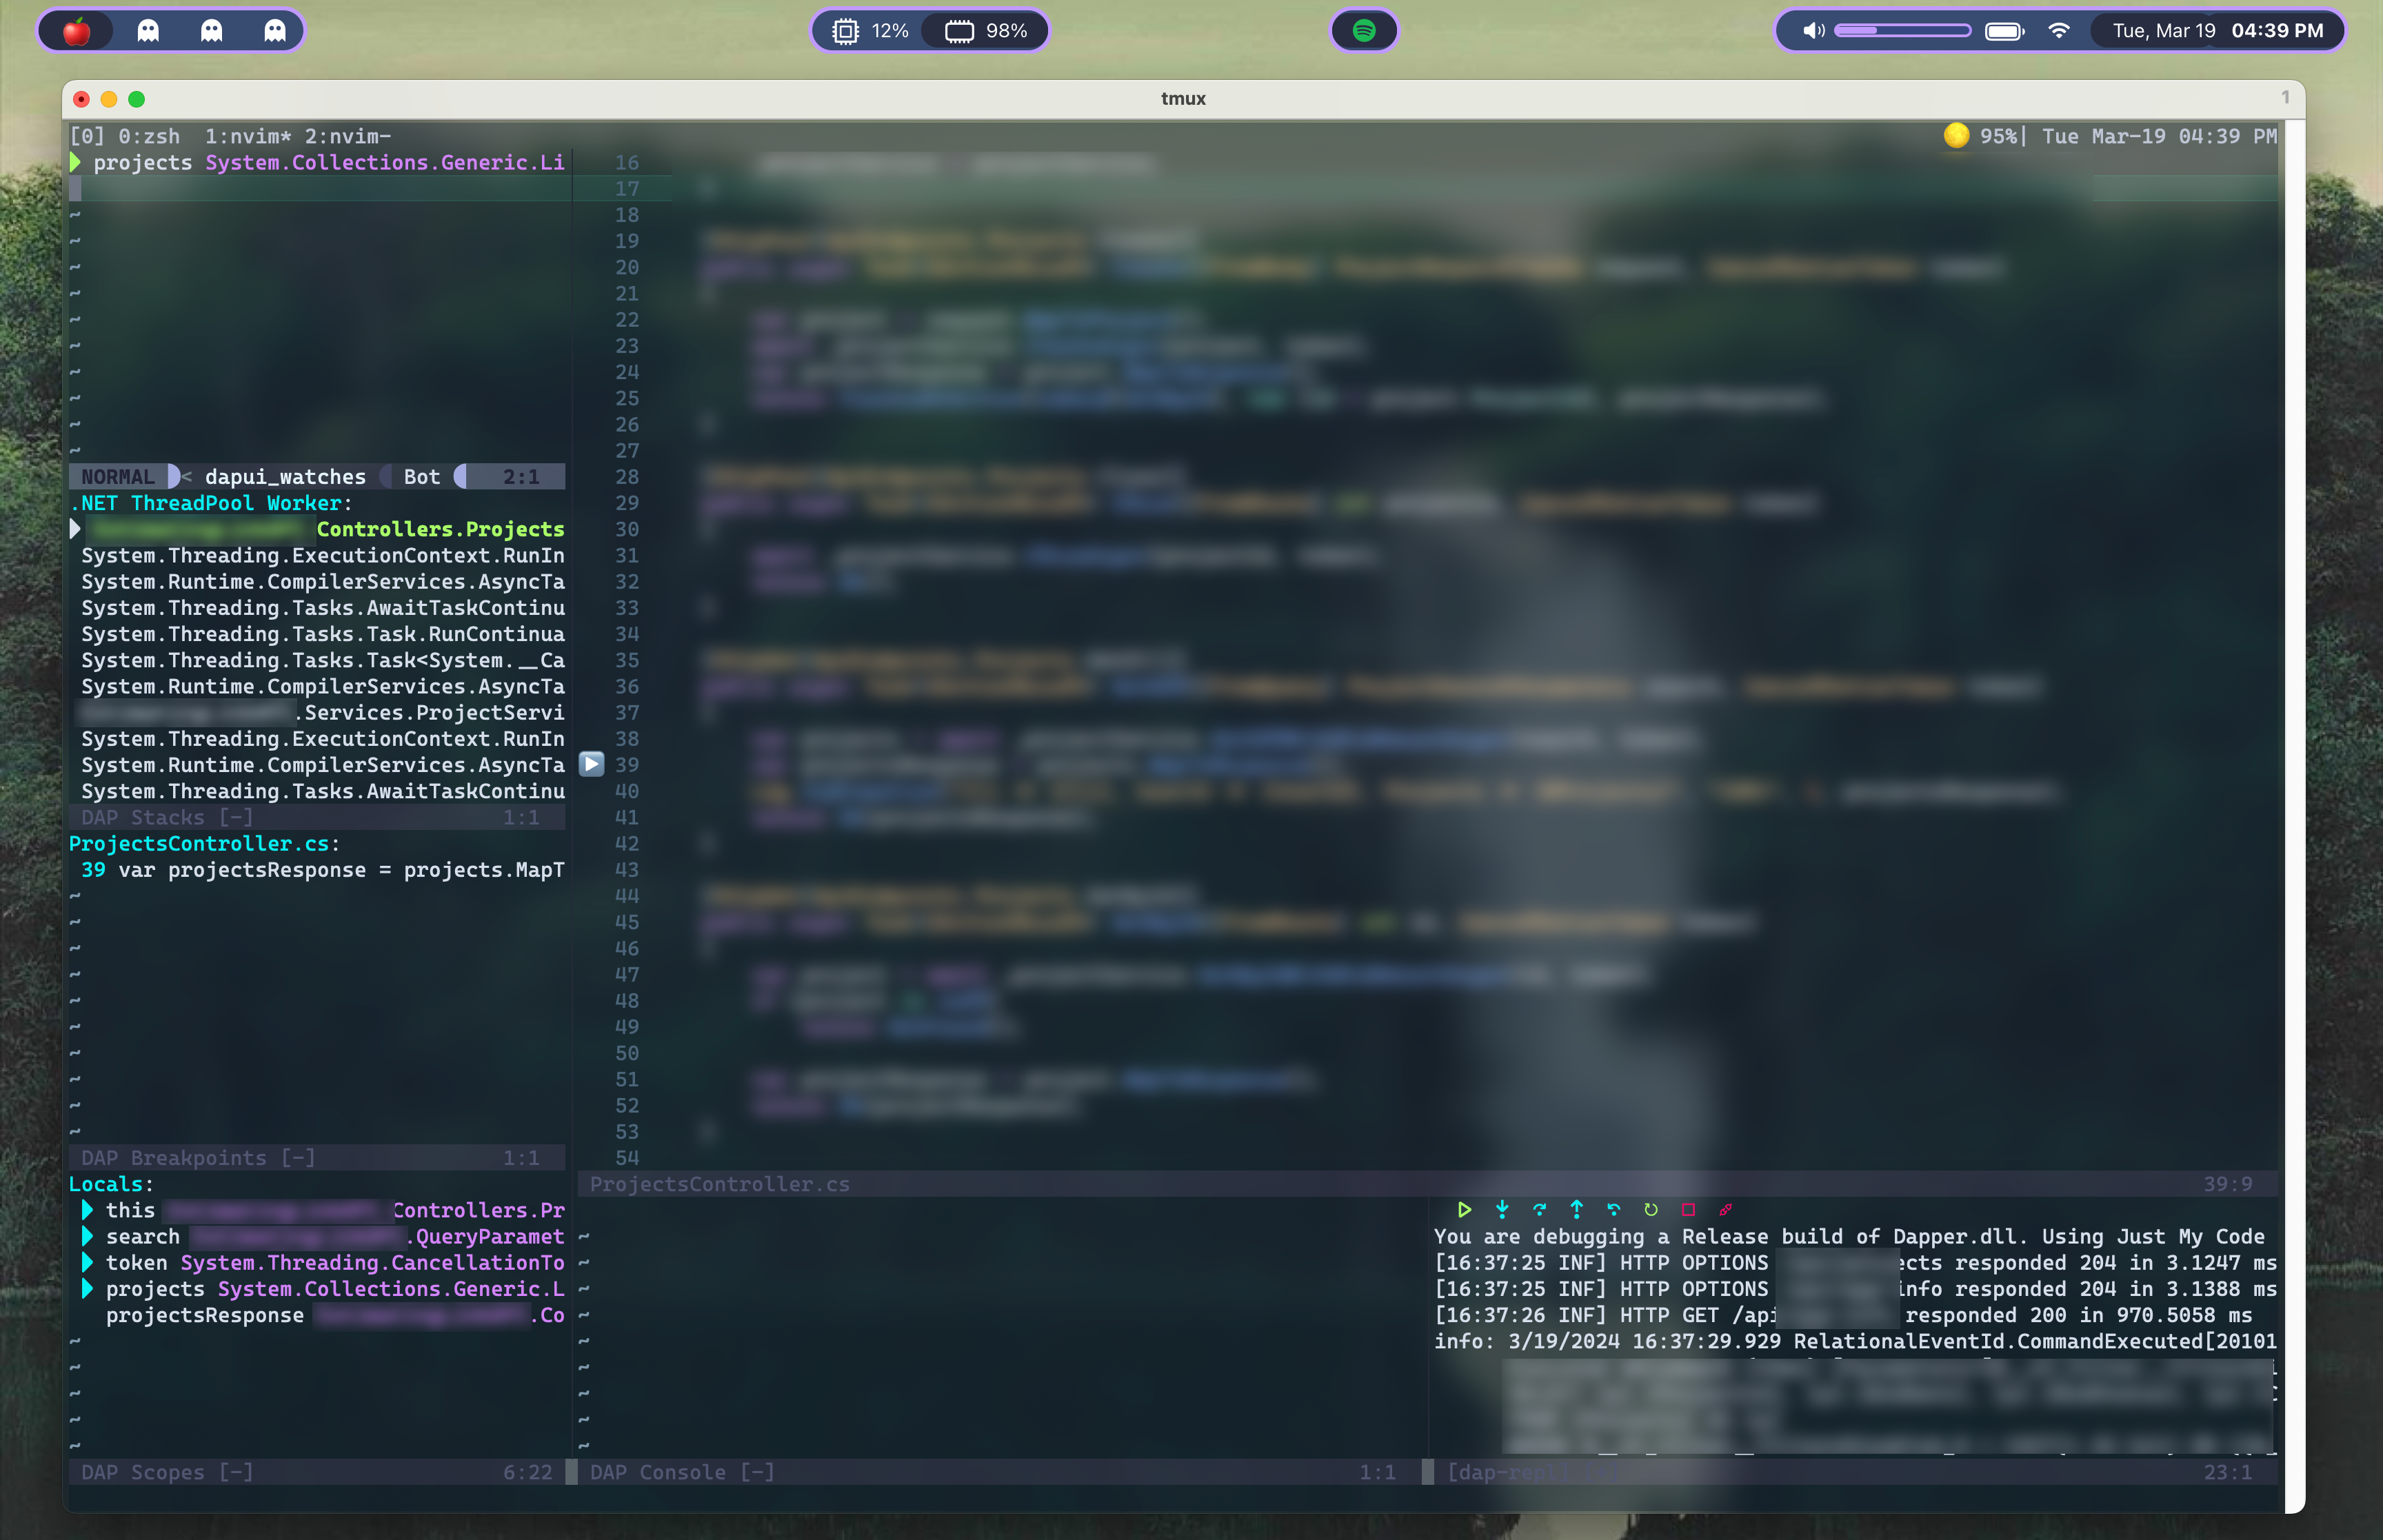
How to Debug ASP.NET Projects in Neovim
Date: March 20, 2024
By integrating nvim-dap and nvim-dap-ui, you can step through code, inspect variables, and evaluate expressions directly within Neovim.

There are already numerous tutorials on getting nvim-dap working. I highly recommend taking a look at these videos first:https://youtu.be/RziPWdTzSV8?si=nRt3AMpqczHrwNy4https://youtu.be/oYzZxi3SSnM?si=A6FiQpoYqUC1767V
This article focuses on ASP.NET debugging in particular, since I had so much trouble getting it working myself.
Prerequisites
- Neovim
- Packer or any other package manager for Neovim
- .NET runtime installed
Installation
Install Debugging Plugins:
Use your package manager (e.g., Packer) to install the following plugins:
use 'mfussenegger/nvim-dap'
use 'rcarriga/nvim-dap-ui'
Build netcoredbg:
https://github.com/Samsung/netcoredbg
Netcoredbg is the underlying dotnet debugger that nvim-dap will tap into. For Apple Silicon, you'll need to build
netcoredbgfrom source to ensure compatibility; You need to install cmake, and make or ninja, as well as a .NET runtimebashgit clone <https://github.com/Samsung/netcoredbg.git> cd netcoredbg mkdir build && cd build cmake .. make
You should now have a netcoredbg executable in /build/src directory
Configuration
3. Configure nvim-dap:
Add the following configuration to your init.lua or equivalent Neovim configuration file to set up nvim-dap and nvim-dap-ui:
local dap = require('dap')
local dapui = require("dapui")

dapui.setup()

dap.adapters.coreclr = {
  type = 'executable',
  command = '/path/to/netcoredbg', --add your netcoredbg executable path
  args = {'--interpreter=vscode'}
}

dap.configurations.cs = {
  {
    type = "coreclr",
    request = "launch",
    name = "Launch .NET Core App",
    program = "/path/to/your/project.dll", --point to the .dll project build file
    args = {},
    cwd = "/path/to/your/project", --root directory of your project
    env = {
      ASPNETCORE_ENVIRONMENT = "Development",
      ASPNETCORE_URLS = "<https://localhost:5001>;<http://localhost:5000>"
    },
    console = 'integratedTerminal',
  },
}

--breakpoint icons
vim.fn.sign_define('DapBreakpoint', { text='🛑', texthl='DapBreakpoint', linehl='DapBreakpoint', numhl='DapBreakpoint' })
vim.fn.sign_define('DapStopped', { text='▶️', texthl='DapStopped', linehl='DapStopped', numhl='DapStopped' })

--toggle breakpoint
vim.api.nvim_set_keymap("n", "<leader>dt", ":DapToggleBreakpoint<CR>", {noremap=true})

-- start debugging
vim.api.nvim_set_keymap("n", "<leader>dc", ":DapContinue<CR>", {noremap=true})

--reset layout
vim.api.nvim_set_keymap("n", "<leader>dr", "<cmd>lua require('dapui').open({reset = true})<CR>", { noremap = true })

--auto open & close the UI panes
dap.listeners.before.attach.dapui_config = function()
  dapui.open()
end
dap.listeners.before.launch.dapui_config = function()
  dapui.open()
end
dap.listeners.before.event_terminated.dapui_config = function()
  dapui.close()
end
dap.listeners.before.event_exited.dapui_config = function()
  dapui.close()
end
These settings define key bindings for starting and resetting the debugger UI, specify the path to the netcoredbg executable, and include essential configuration for launching an ASP.NET Core application.
Pay close attention to the env config section; this should align with the launchSettings.json of your ASP.NET project; Make sure your ports and launch settings are correct here, this is what tripped me up and cost me hours trying to get this all working.
Build Your .NET Project:
Before debugging, make sure your .NET project is built so netcoredbg has a .dll to launch:
dotnet buildDebugging Commands:
- To start debugging, use
:DapContinue. - Your API should now be running, and you can interact with it through the configured ports 👍